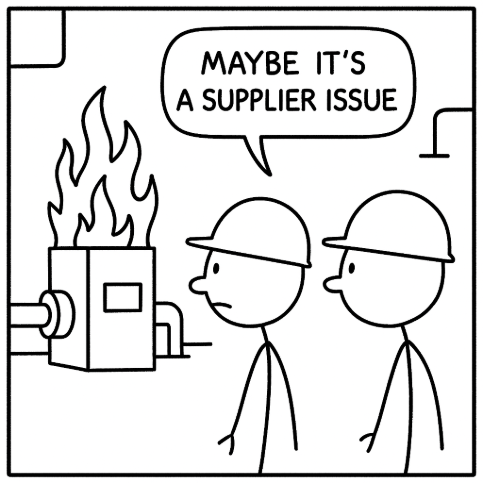
Your team runs a root cause analysis (RCA) on a supplier defect in January. They fix it. In March, a different product line has a similar issue, different supplier. They run another RCA. In June, same pattern, third supplier.
That’s a bad string of luck with suppliers.
Or is it?
What if all three defects were related to the incoming inspection processes, and all the money spent on rework could have been prevented with a simple change?
Sometimes this happens. You discover a problem during one RCA, solve it, log it, then move on until another problem occurs. It’s an easy habit when there are so many functions to oversee each day.
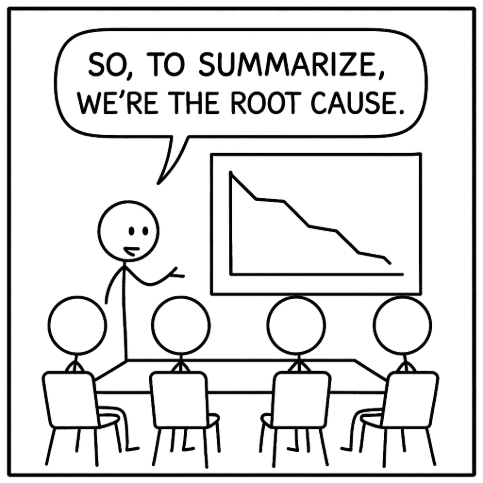
But you should treat each RCA finding like a piece of evidence in a pattern, one that’s costing your organization. The goal is to find the connections in your data and turn them into decisions that prevent future problems.
Finding The Patterns in the Data
You’re likely familiar with the Pareto principle where roughly 80% of consequences come from 20% of the causes. It’s a good thing to remember here.
If you’re noticing a problem at one plant, odds are good that the same root cause might be appearing elsewhere under different symptoms.
These issues are costly. The Cost of Poor Quality (COPQ) typically runs between 15-20% of total sales revenue for manufacturing companies. For a $100 million manufacturer, that’s up to $20 million annually spent on scrap, rework, and warranty claims—often from systemic root causes that remain hidden because RCA data lives in disconnected files.
Of course, if you don’t have an easy way to surface patterns from your RCA data, this will be harder. If you’re using spreadsheets scattered across departments, or relying on memory and recent presentations, connecting the dots becomes nearly impossible.

Even if you’re storing data digitally, without deliberately analyzing it for trends, those patterns stay buried.
This is a good time to evaluate your current process for logging and storing defects, supplier scorecards and other information. If you don’t have a quality management system (QMS) in place, now is a good time to evaluate whether you should add one.
After all, when costs stem from systemic root causes that remain hidden because RCA data lives in disconnected spreadsheets and PDF reports, you’re looking at preventable losses in the hundreds of thousands to millions of dollars.
Turning RCA Findings into Risk Mitigation
Odds are good that you’re already conducting strong investigations to sniff out problems and correct them. But the goal is to use this information to prevent future problems.
Here’s a mini framework you can follow:
1. Centralize your RCA data
Create one centralized location where you log all RCAs. If you’re using spreadsheets for now, ensure they’re all in a secure but shareable location. (Quality management systems like ETQ Reliance® can automate this centralization, but start with whatever tools you have.)
Include information that well help you track issues, such as:
- Dates
- Products/lines
- Root causes
- Corrective actions
- Cost impact
If multiple sites exist, ensure each feeds into this central repository.
2. Create a consistent taxonomy
Tag every RCA with standardized categories. Be specific. Terms like “supplier issue” and “processor error” are too vague. You can keep them short and informative, such as “incoming inspection; missing material cert” or even “assembly; torque spec not followed”
Good tags enable filtering and pattern spotting. Common categories include:
- Equipment failure (by machine type)
- Training gap (by skill/process)
- Supplier quality (by failure mode)
- Material specification
- Documentation/procedure clarity
3. Schedule quarterly pattern reviews
Add aggregate RCA analysis to your management reviews. Ask:
- Which root causes appear most frequently?
- What’s the total cost impact by category?
- Are certain products, lines, or sites showing similar issues?
- What systemic changes would prevent multiple RCAs?
Create a simple dashboard (even in Excel if you need to) that tracks RCA count and cost by category over time.
4. Act systemically, not just correctively
When patterns emerge, address the underlying system:
- If you see multiple training-related RCAs, then revise onboarding program
- If you see recurring inspection misses, then update incoming inspection checklist and add verification step
- If you see similar equipment failures across sites, then implement preventive maintenance protocol company-wide
Closing the Loop
Remember those three supplier defects at the beginning of this article? If that team had been tagging RCAs by process area and reviewing patterns quarterly, they might have been able to spot the incoming inspection gap after the first incident.
A simple procedural change—adding a verification step to the inspection checklist—would have prevented the second and third defects entirely, saving tens of thousands in rework costs.
Your RCAs are already revealing these patterns. You just need to start looking for them. The patterns you find might cost more than you think.